![]()
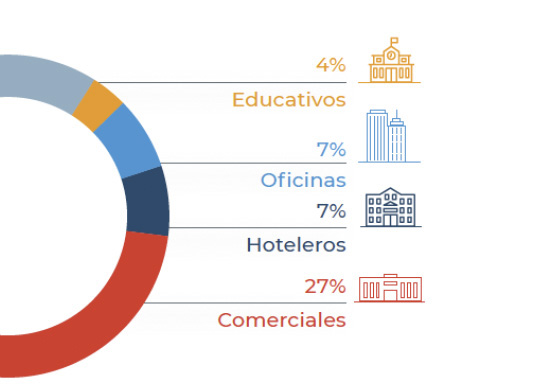
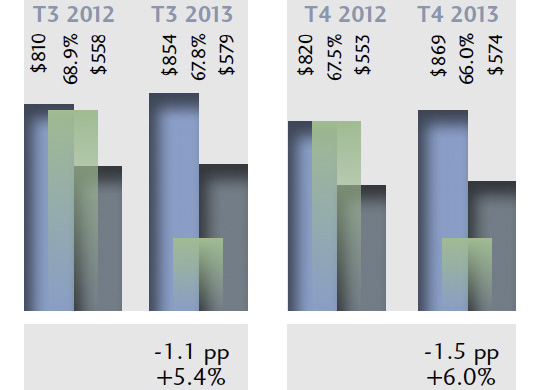
The graphic support for annual reports must be selected and placed strategically to create a visually appealing and highly informative report. Charts and tables are essential for presenting financial and operational data clearly and concisely, allowing readers to quickly interpret trends and results. Icons and diagrams help simplify complex concepts and improve content accessibility.